Software Architecture
SedTRAILS was designed with a modular architecture to facilitate maintenance, scalability, and extensibility. This document describes the software architecture of SedTRAILS (Sediment Transport and Lagrangian Simulator), a particle tracking system for coastal environments. The architecture follows the C4 model, presenting the system at multiple levels of detail from high-level context to detailed component diagrams.
SedTRAILS is still under active development. Some architectural details may be missing form the implementation and others may evolve as new features are added and improvements are made.
Table of Contents
System Context
The System Context diagram provides the highest-level view of SedTRAILS, showing how it fits within its environment and interacts with external systems and users.
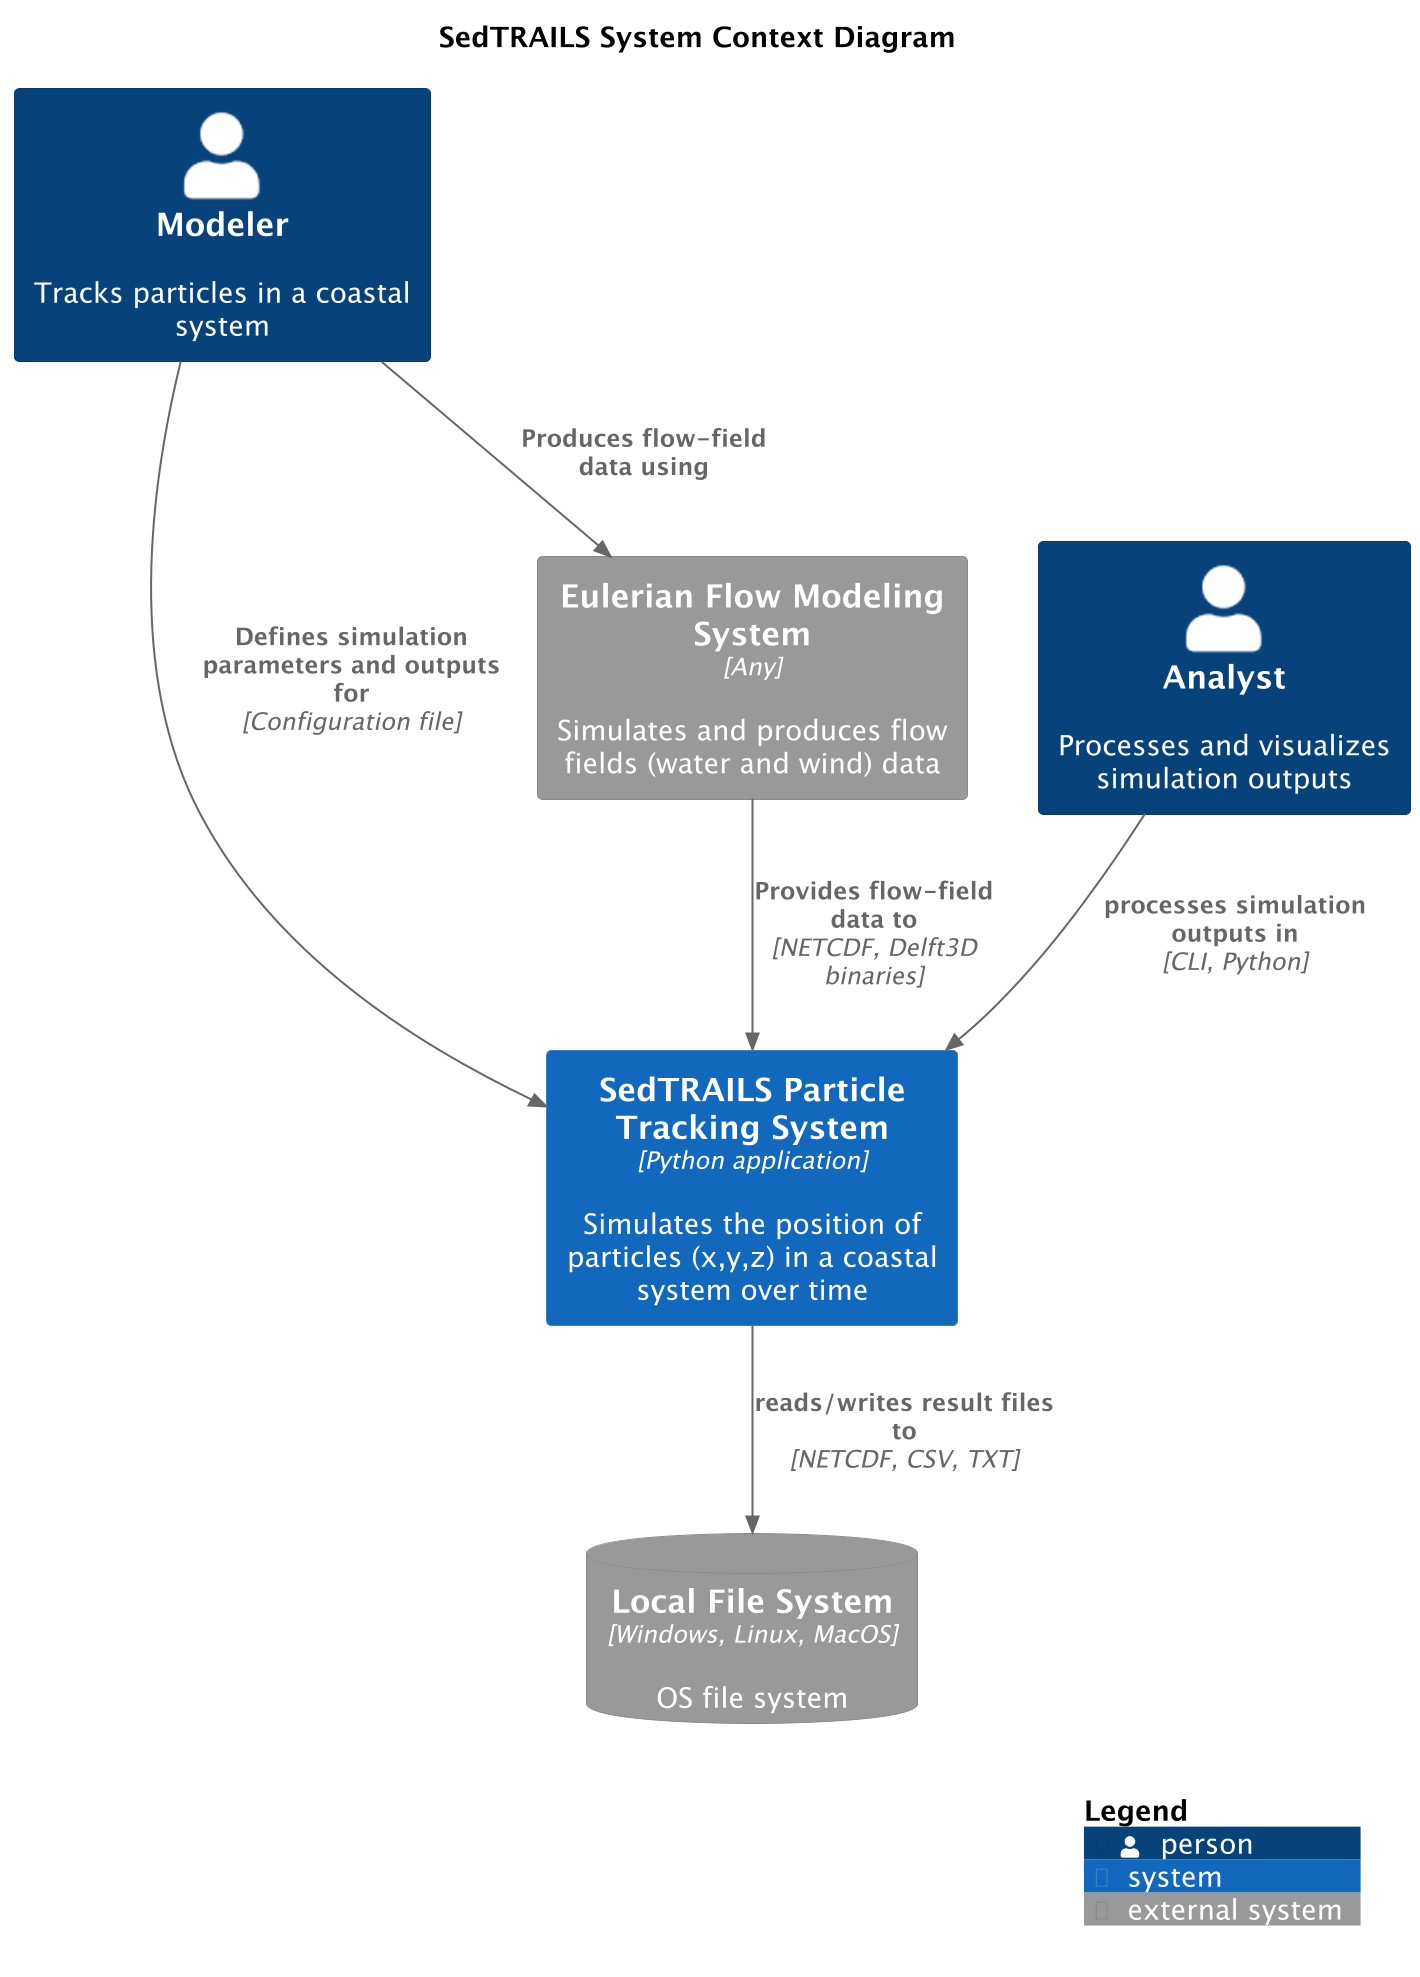
Key Elements
Users:
Modeler: Defines simulation parameters and configures the system to track particle movement in coastal environments
Analyst: Processes and visualizes simulation outputs for analysis and interpretation
SedTRAILS System:
The core particle tracking system that simulates particle positions (x, y, z) in coastal environments over time
Implemented as a Python application
External Systems:
Eulerian Flow Modeling System: Provides flow field data (water and wind) from various modeling systems
Local File System: Handles input/output operations for configuration files, flow data, and simulation results
The system reads flow field data in various formats (NetCDF, Delft3D binaries) and produces outputs in standard formats (NetCDF, CSV, TXT).
Container View
The Container diagram shows the major applications and data stores that make up SedTRAILS, along with their relationships and communication patterns.
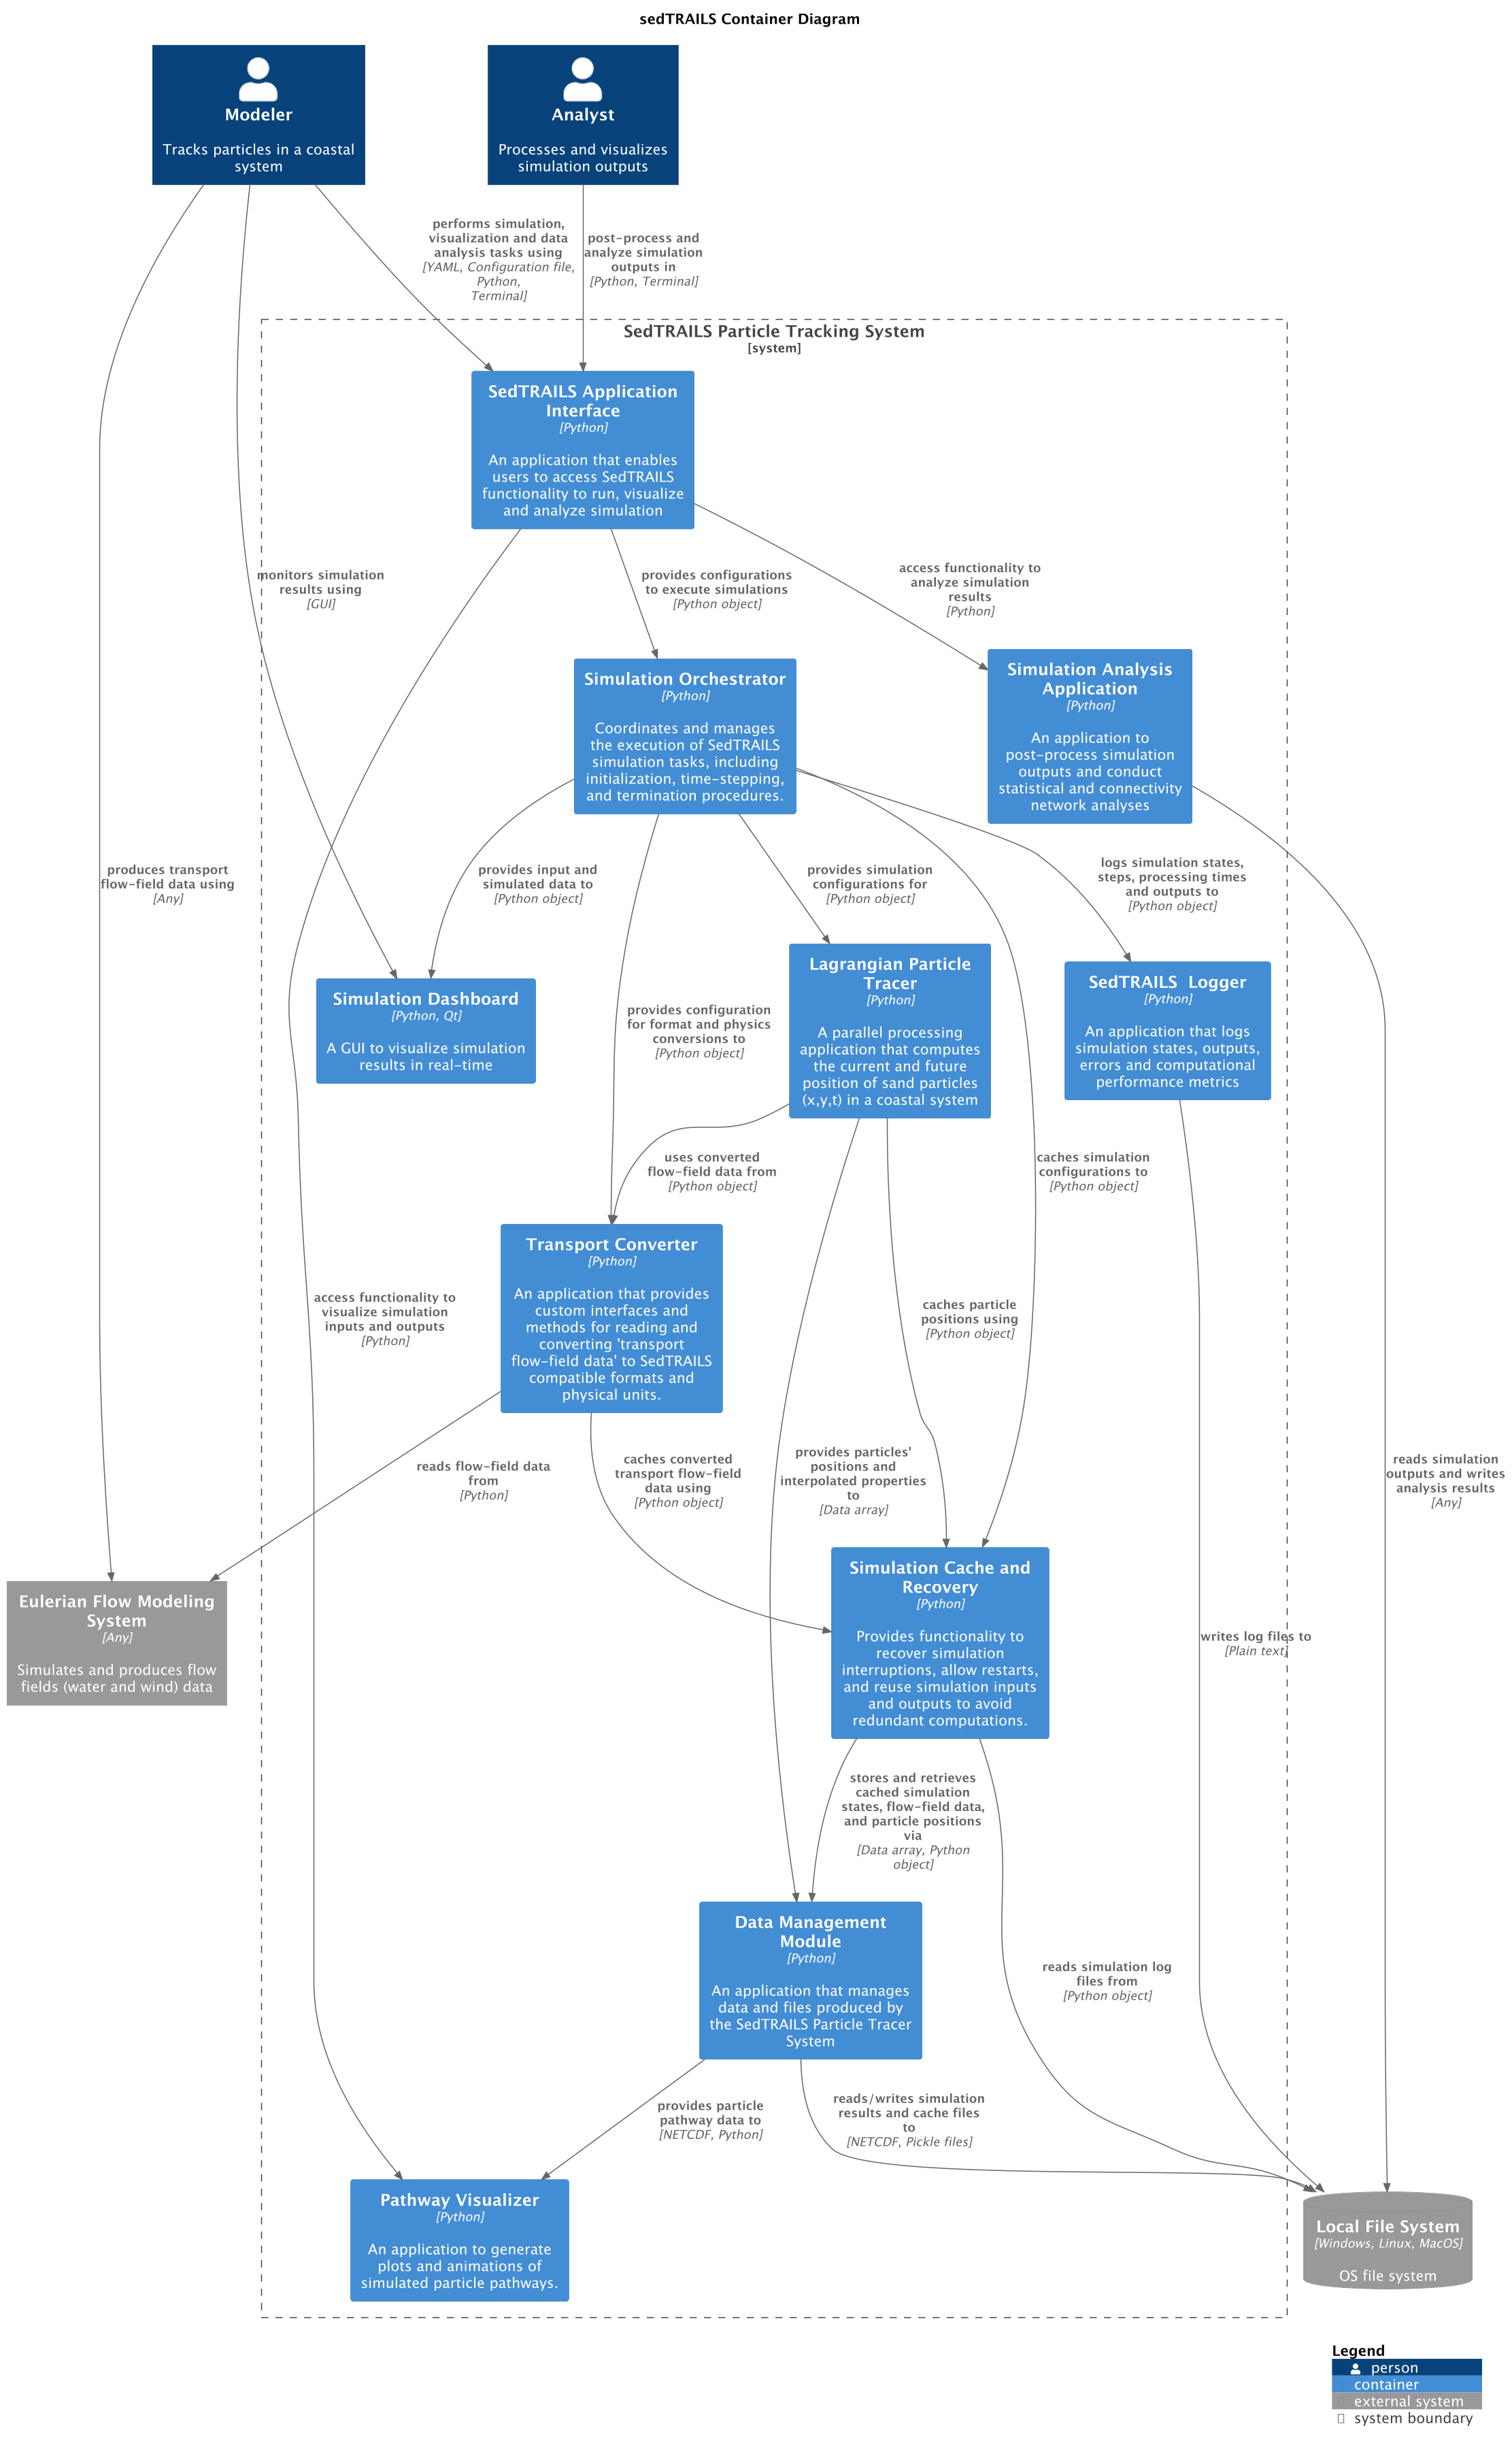
Core Containers
1. SedTRAILS Application Interface
A Python-based interface that provides access to SedTRAILS functionality through both CLI and programmatic APIs. Enables users to run simulations, visualize results, and analyze data.
2. Simulation Orchestrator
Coordinates and manages the execution of simulation tasks, including initialization, time-stepping, and termination procedures. Acts as the central coordinator for all simulation activities.
3. Lagrangian Particle Tracer
A parallel processing application that computes current and future positions of particles (x, y, t) in coastal systems. This is the computational core of SedTRAILS.
4. Transport Converter
Provides custom interfaces and methods for reading and converting transport flow-field data to SedTRAILS-compatible formats and physical units. Supports multiple input formats through a plugin architecture.
5. Data Management Module
Manages data and files produced by the particle tracer system, including reading/writing simulation results and handling cache files in NetCDF format.
6. Simulation Dashboard
A GUI (Python/Qt) for visualizing simulation results in real-time during execution.
7. Pathway Visualizer
Generates plots and animations of simulated particle pathways for post-processing analysis.
8. Simulation Analysis Application
Provides tools for post-processing simulation outputs, conducting statistical analysis, and performing connectivity network analyses.
9. Simulation Cache and Recovery
Handles simulation interruption recovery, allows restarts, and reuses simulation inputs/outputs to avoid redundant computations.
10. SedTRAILS Logger
Logs simulation states, outputs, errors, and computational performance metrics.
Data Flow
The containers communicate primarily through Python objects and data arrays. The Simulation Orchestrator acts as the central hub, coordinating between the particle tracer, transport converter, cache system, and data manager. Results flow from the particle tracer through the data manager to visualization and analysis tools.
Component Details
Application Interface
The Application Interface provides user access to SedTRAILS functionality through multiple channels.
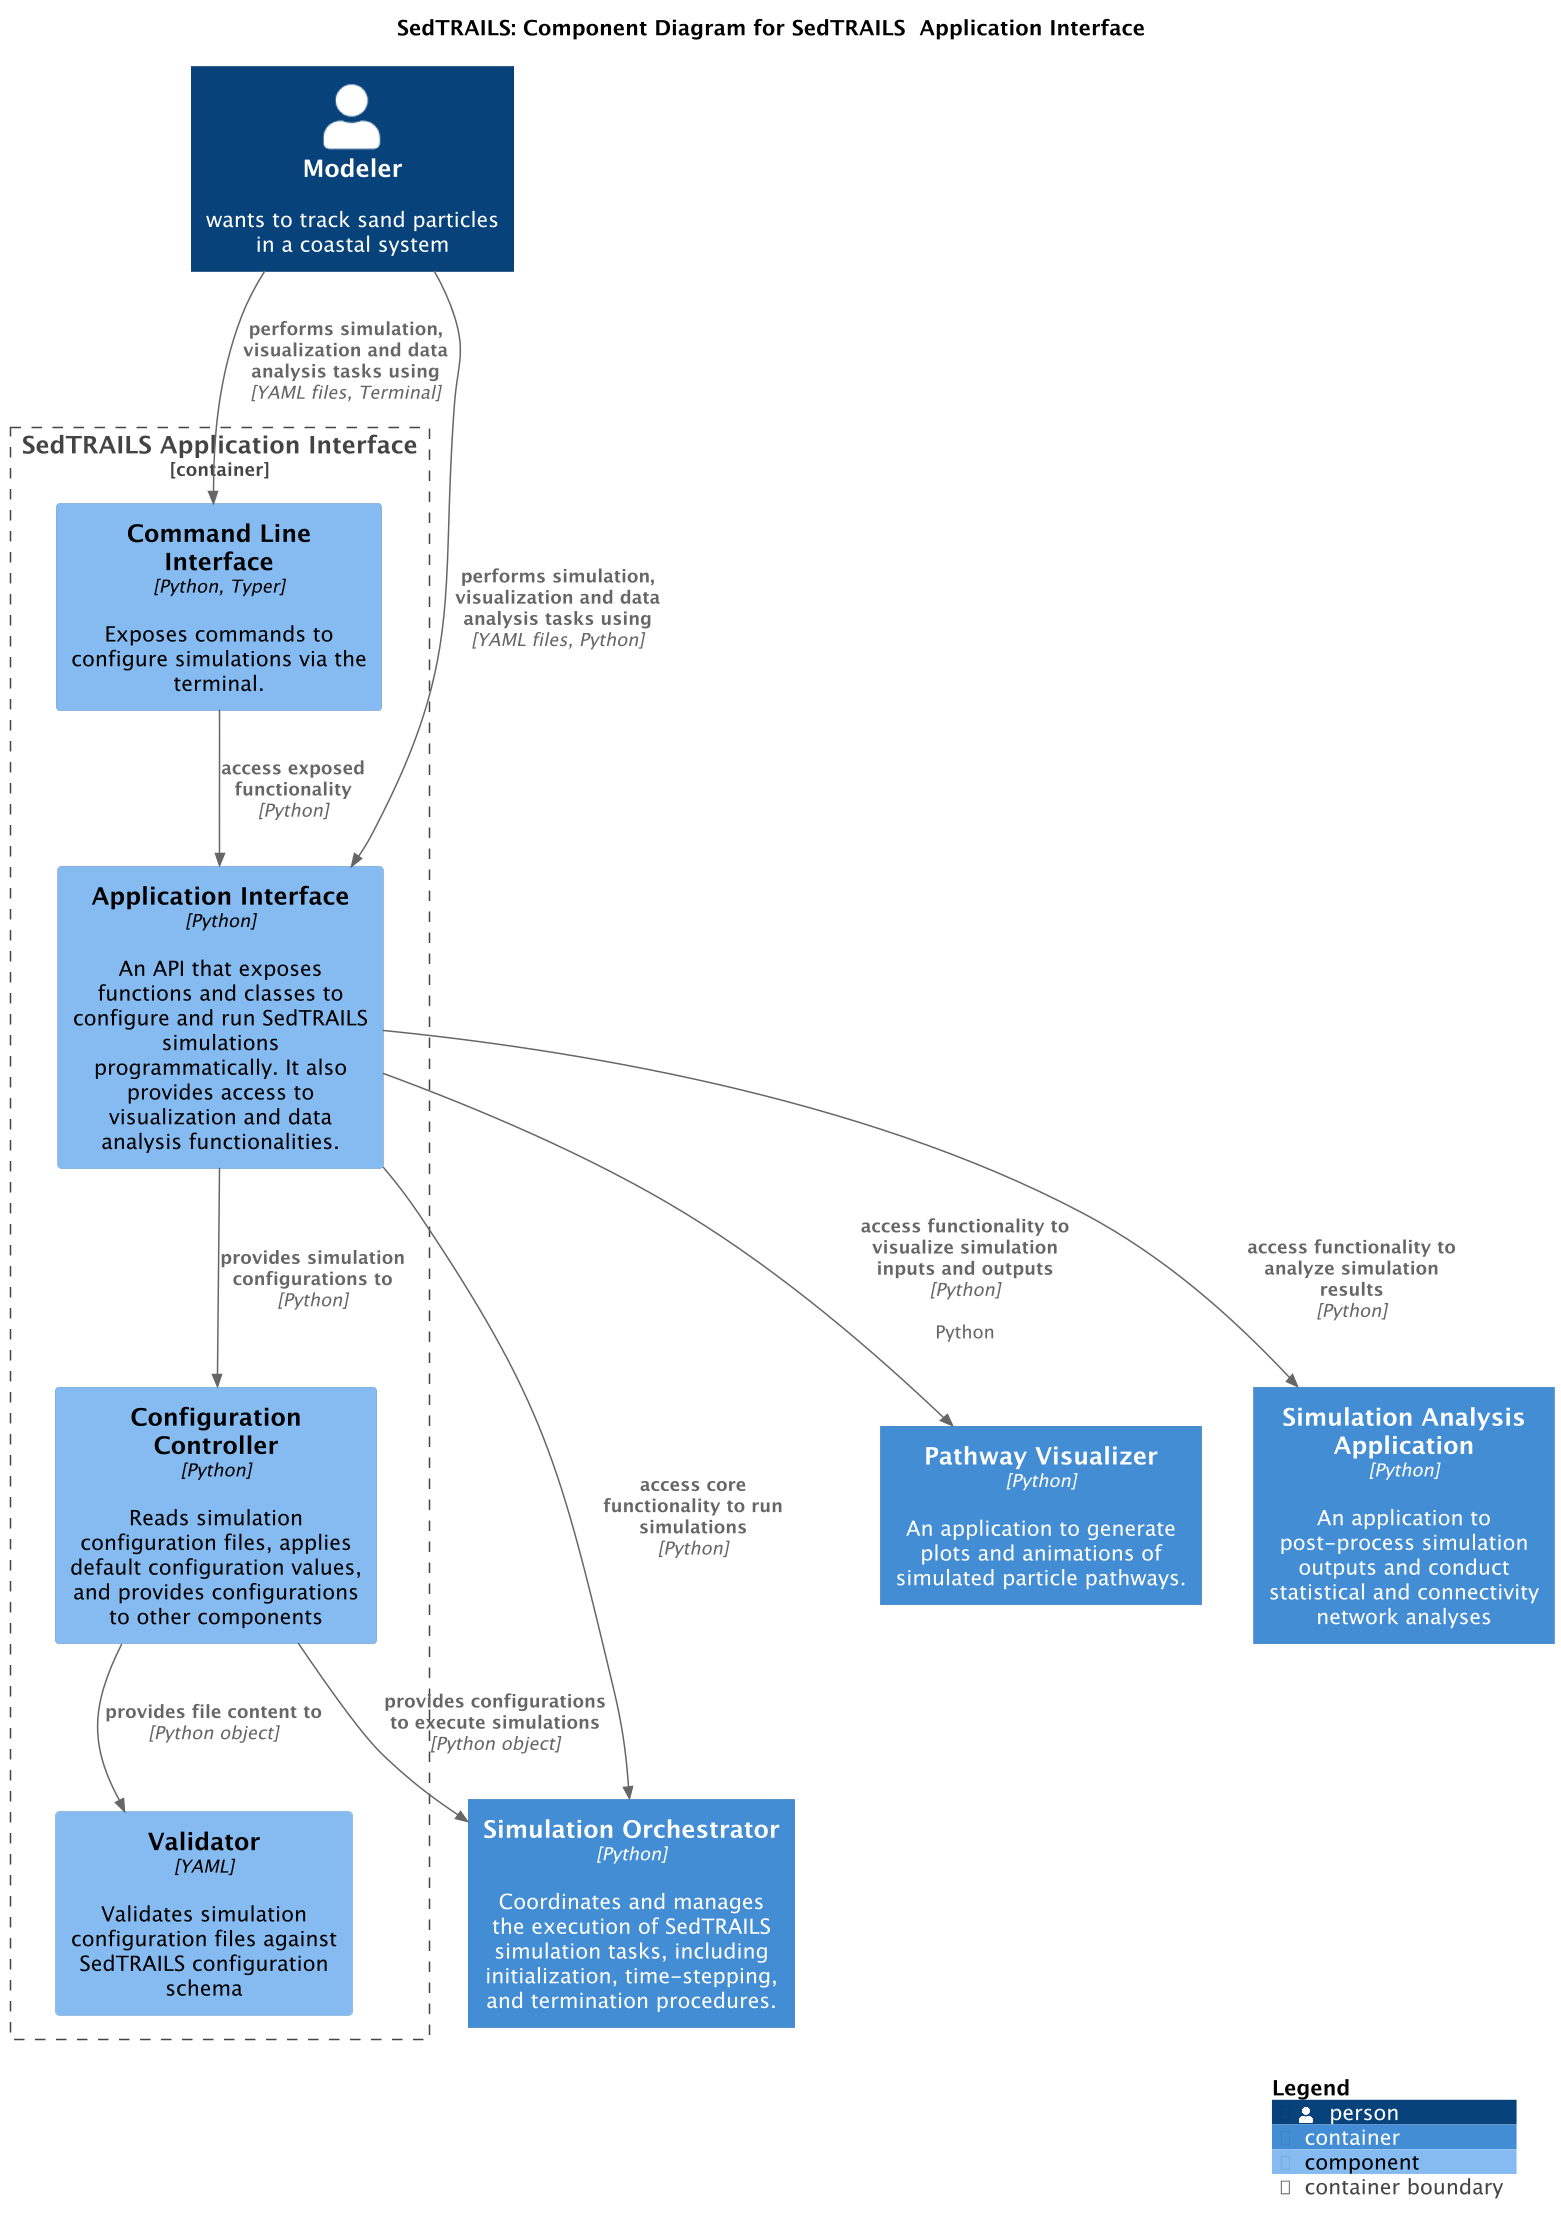
Components:
Command Line Interface (CLI)
Built with Python and Typer
Exposes terminal commands for configuring and running simulations
Provides direct access to core functionality
Application Interface (API)
Python API exposing functions and classes for programmatic access
Enables configuration and execution of simulations through code
Provides access to visualization and analysis functionalities
Configuration Controller
Reads simulation configuration files (YAML)
Applies default values where needed
Distributes configuration to other components
Validator
Validates configuration files against SedTRAILS schema
Ensures configuration correctness before simulation execution
The CLI and Python API both interact with the Configuration Controller to manage simulation parameters, which are then passed to the Simulation Orchestrator for execution.
Simulation Orchestrator
The Simulation Orchestrator manages the overall simulation workflow.
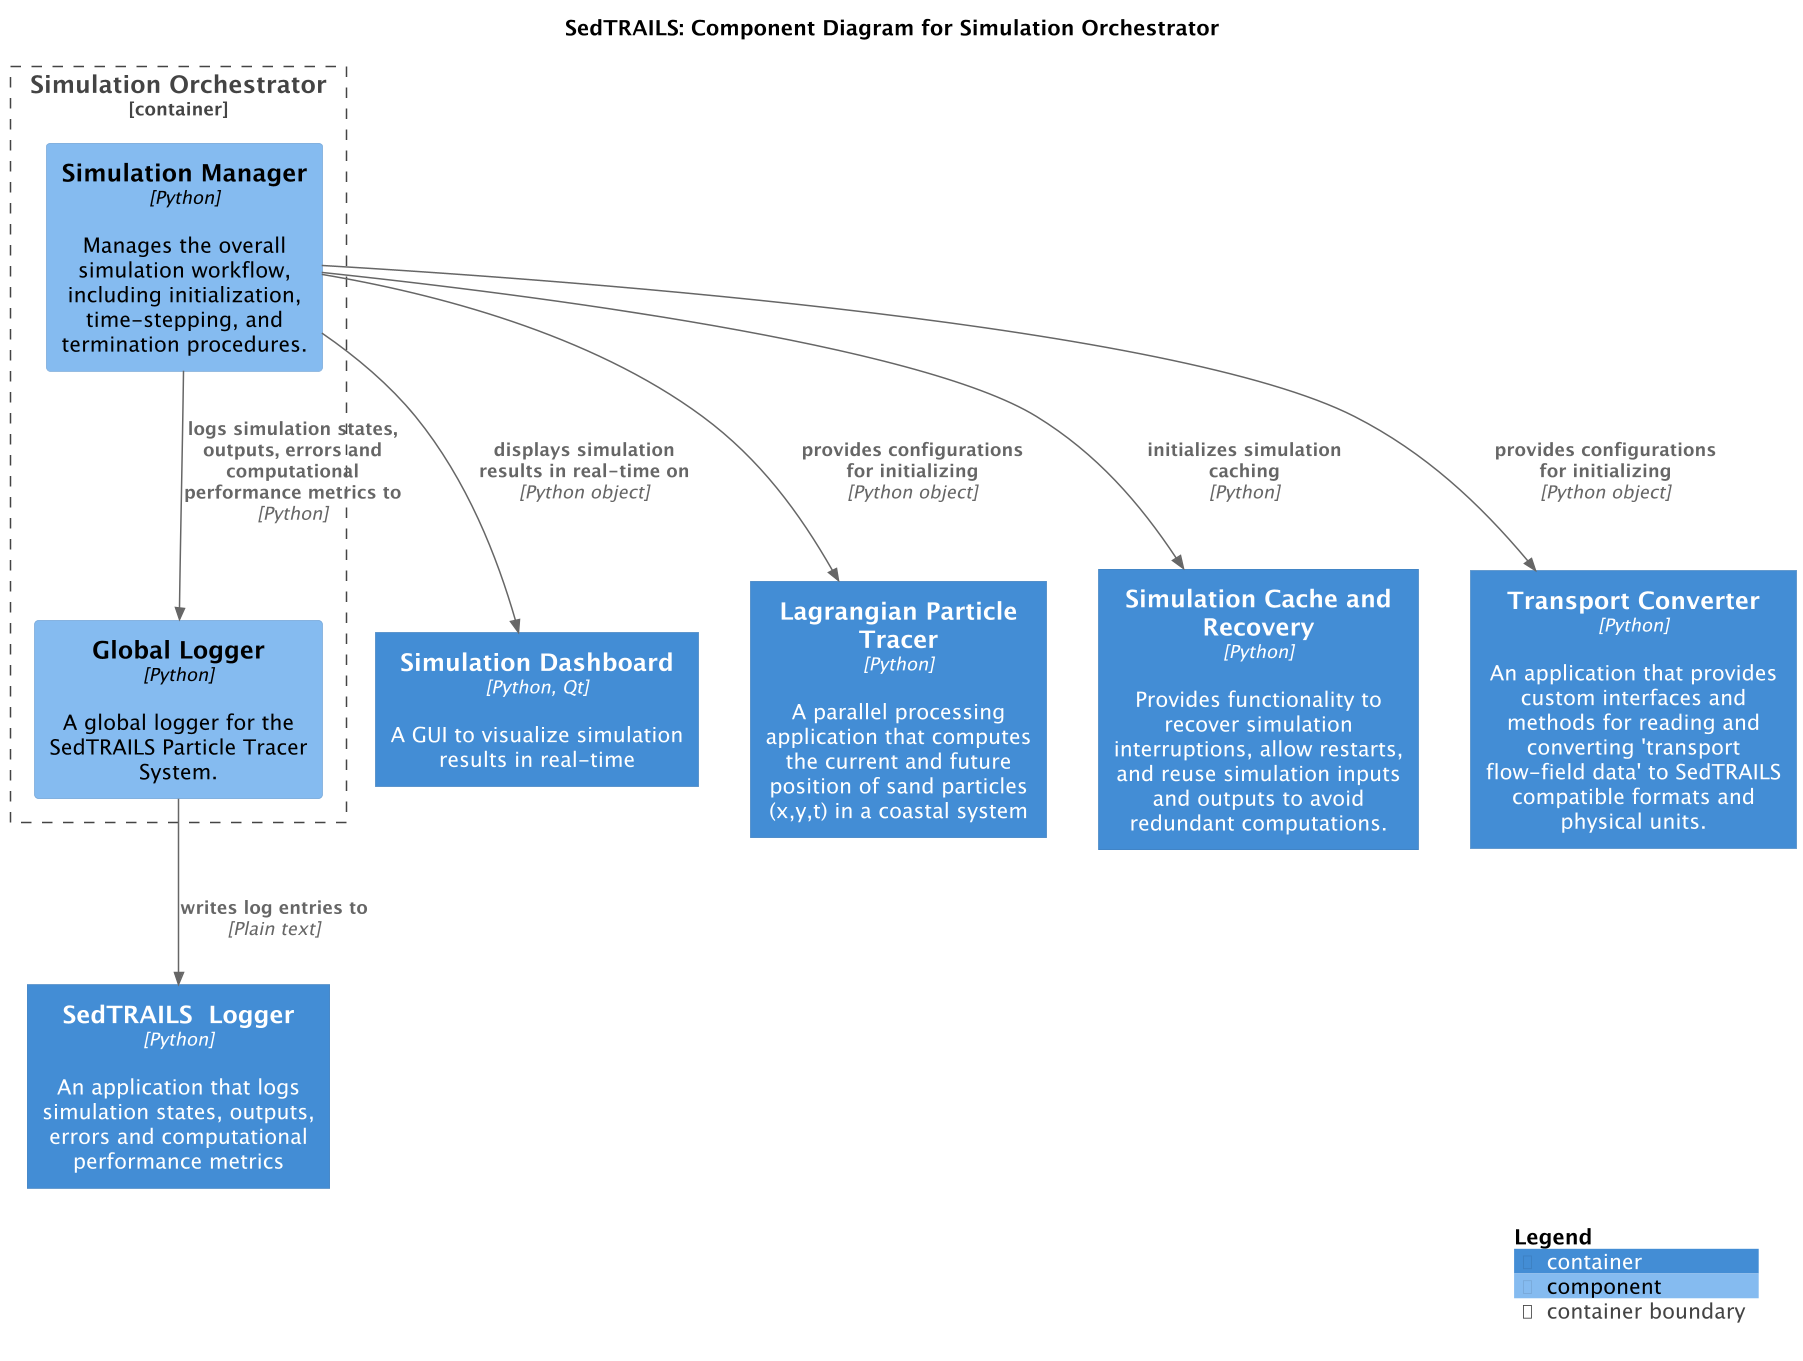
Components:
Simulation Manager
Manages overall simulation workflow
Handles initialization, time-stepping, and termination procedures
Coordinates between all simulation components
Global Logger
Central logging facility for the entire system
Captures simulation states, outputs, errors, and performance metrics
Writes entries to the SedTRAILS Logger
The orchestrator receives configurations from the Application Interface and coordinates the Transport Converter, Particle Tracer, Dashboard, and Cache systems to execute simulations.
Transport Converter
The Transport Converter transforms flow field data from various Eulerian modeling systems into SedTRAILS-compatible formats.
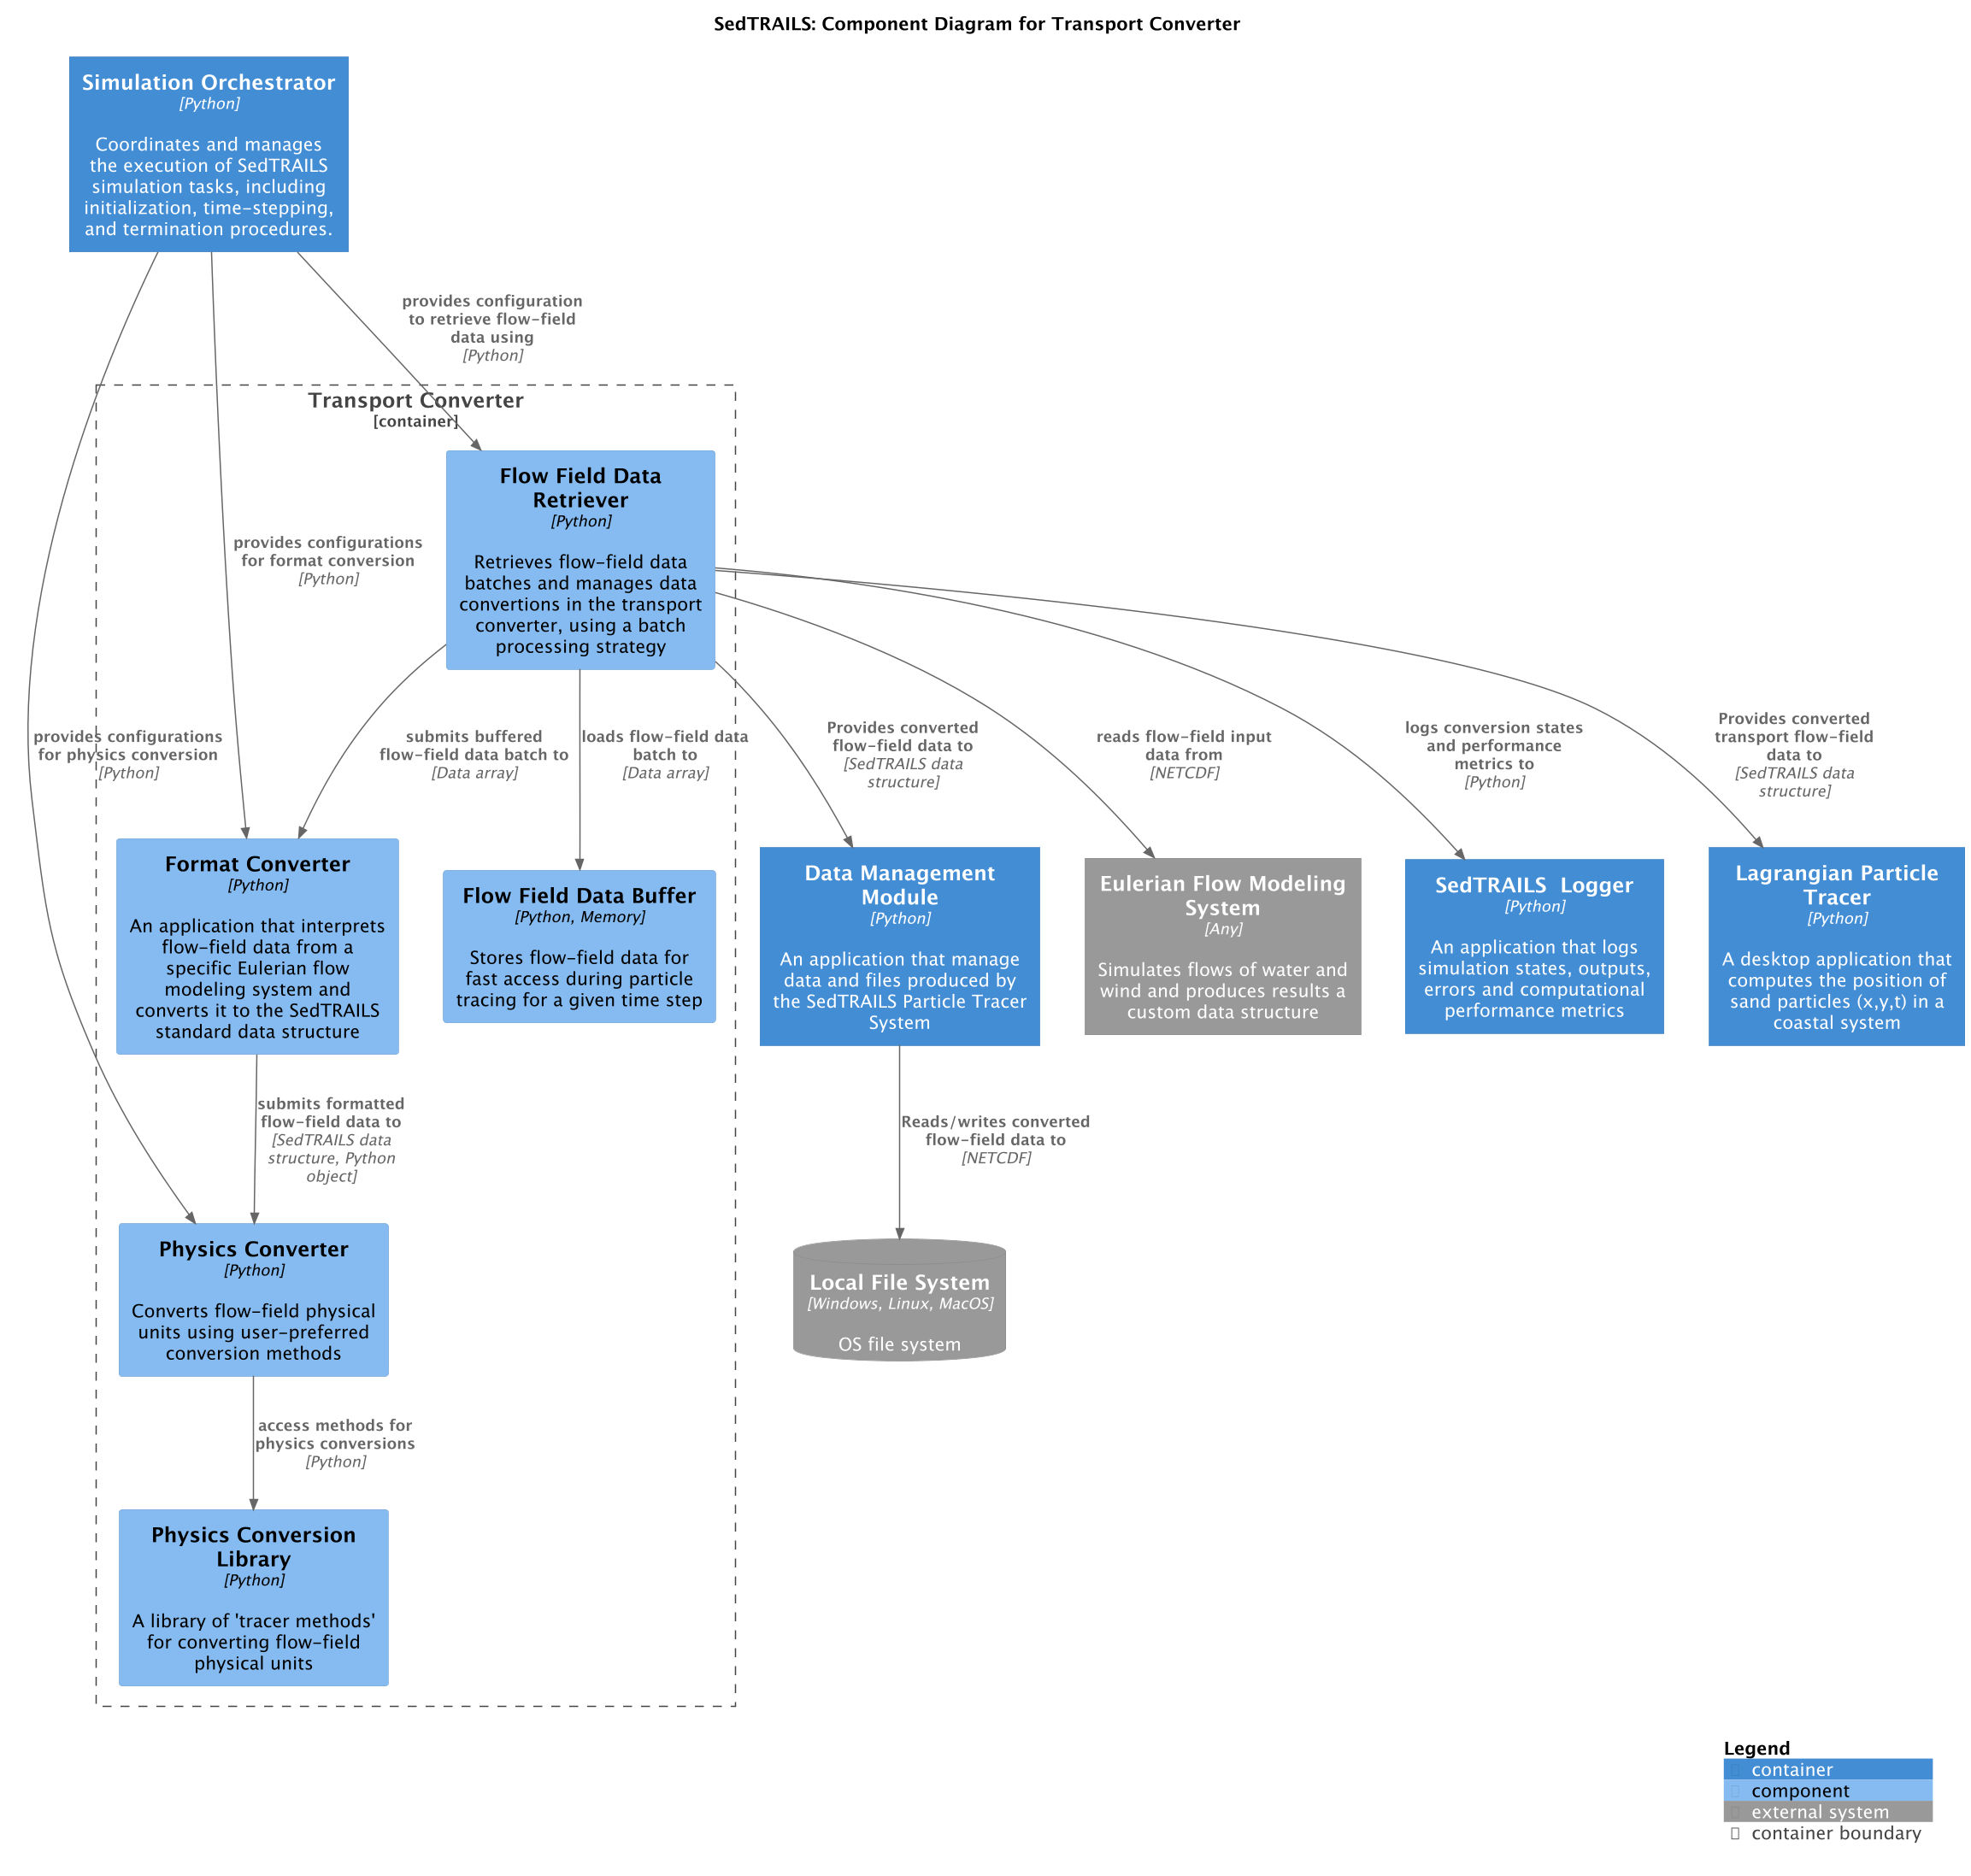
Components:
Format Converter
Interprets flow-field data from specific Eulerian modeling systems
Converts data to SedTRAILS standard data structure
Supports multiple input formats through plugins
Physics Converter
Converts flow-field physical units
Applies user-preferred conversion methods
Interfaces with the Physics Conversion Library
Physics Conversion Library
Library of tracer methods for converting flow-field physical units
Includes methods like Soulsby, Van Westen, and Bertin formulations
Flow Field Data Retriever
Retrieves flow-field data in batches
Manages data conversions using batch processing strategy
Coordinates between file system and converters
Flow Field Data Buffer
Stores flow-field data in memory
Enables fast access during particle tracing
Optimized for current time step operations
The converter reads data from external flow modeling systems, processes it through format and physics conversions, and provides standardized data to the particle tracer.
Lagrangian Particle Tracer
The Particle Tracer is the computational heart of SedTRAILS, calculating particle positions and states.
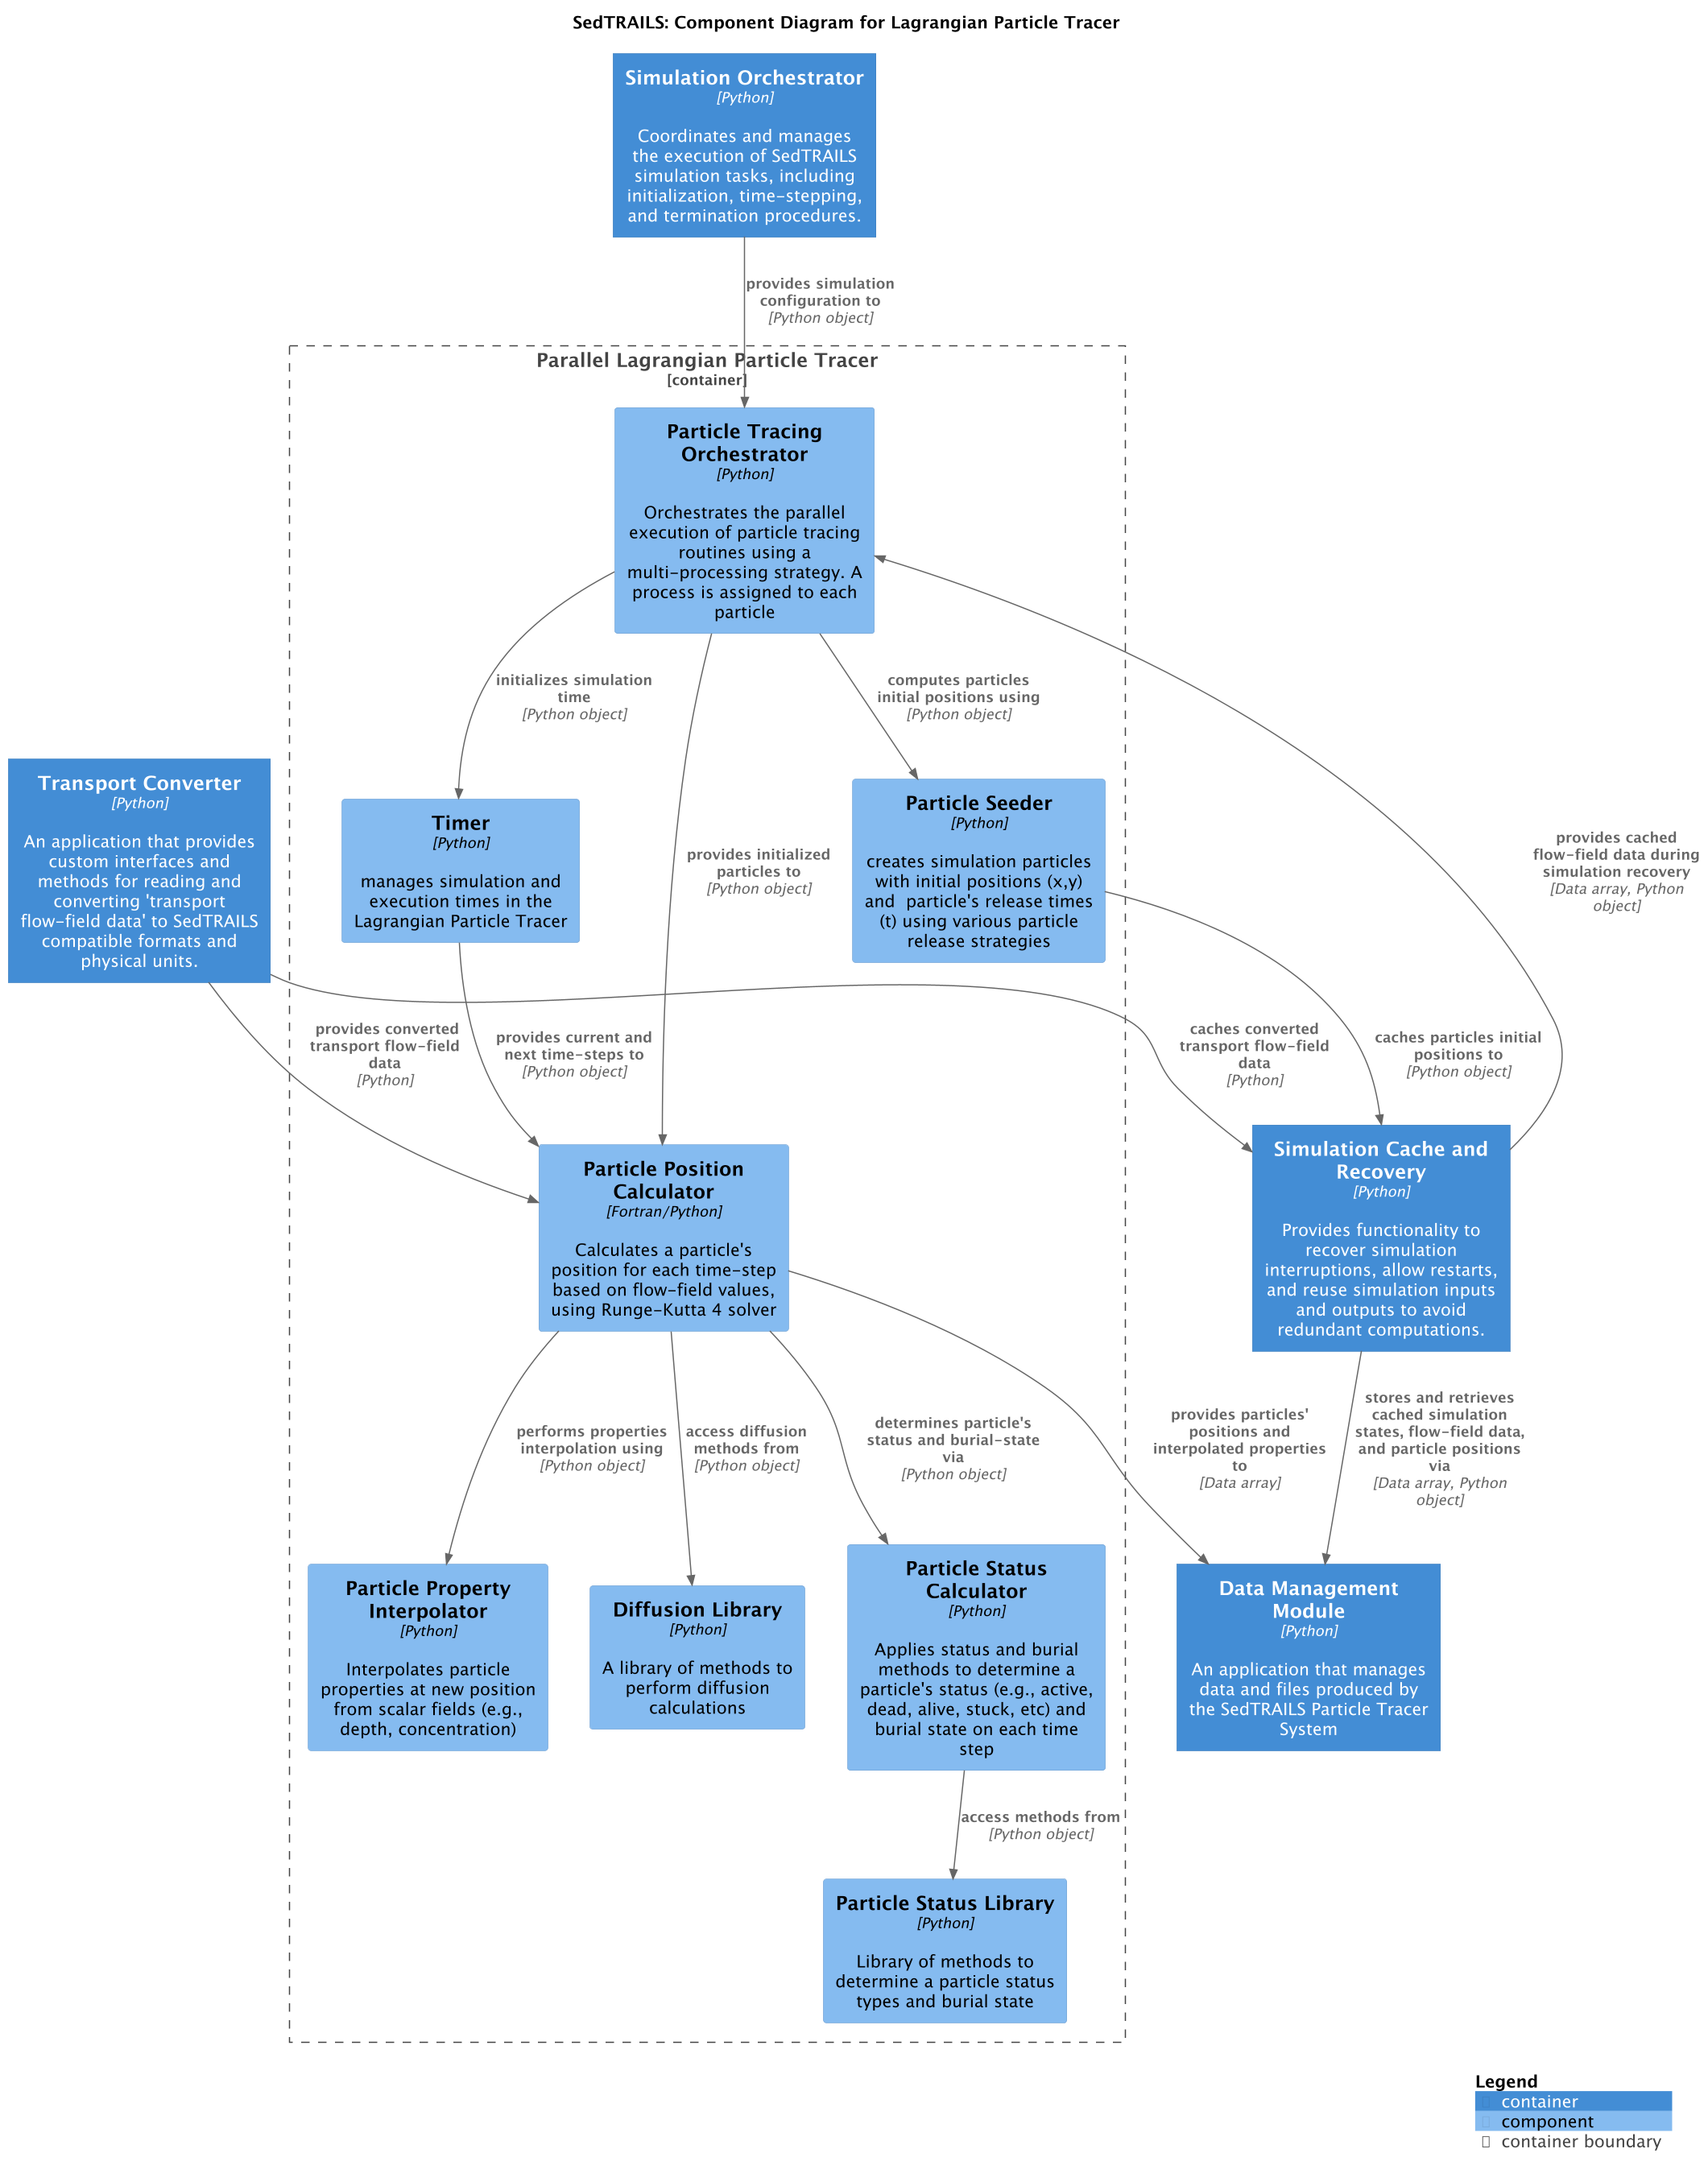
Components:
Particle Seeder
Creates simulation particles with initial positions (x, y)
Assigns particle release times (t)
Supports various seeding strategies
Particle Tracing Orchestrator
Manages parallel execution of particle tracing
Uses multi-processing strategy
Assigns processes to particle groups
Timer
Manages simulation and execution times
Provides time-stepping control
Coordinates temporal aspects of particle tracking
Particle Position Calculator
Implemented in Fortran/Python for performance
Calculates particle positions for each time step
Uses Runge-Kutta 4 solver
Incorporates flow-field values and diffusion
Particle Status Calculator
Determines particle status (active, dead, alive, stuck, etc.)
Calculates burial state for each time step
Uses status methods from the Status Library
Particle Status Library
Collection of methods for determining particle status types
Handles burial state calculations
Particle Property Interpolator
Interpolates particle properties at new positions
Works with scalar fields (depth, concentration, etc.)
Diffusion Library
Provides methods for diffusion calculations
Supports various diffusion models
The tracer orchestrates particle initialization through the seeder, manages time-stepping with the timer, and calculates positions and states using specialized calculators. Results are passed to the data manager for storage and analysis.
Data Management Module
The Data Management Module handles input/output operations, data storage, and result management.
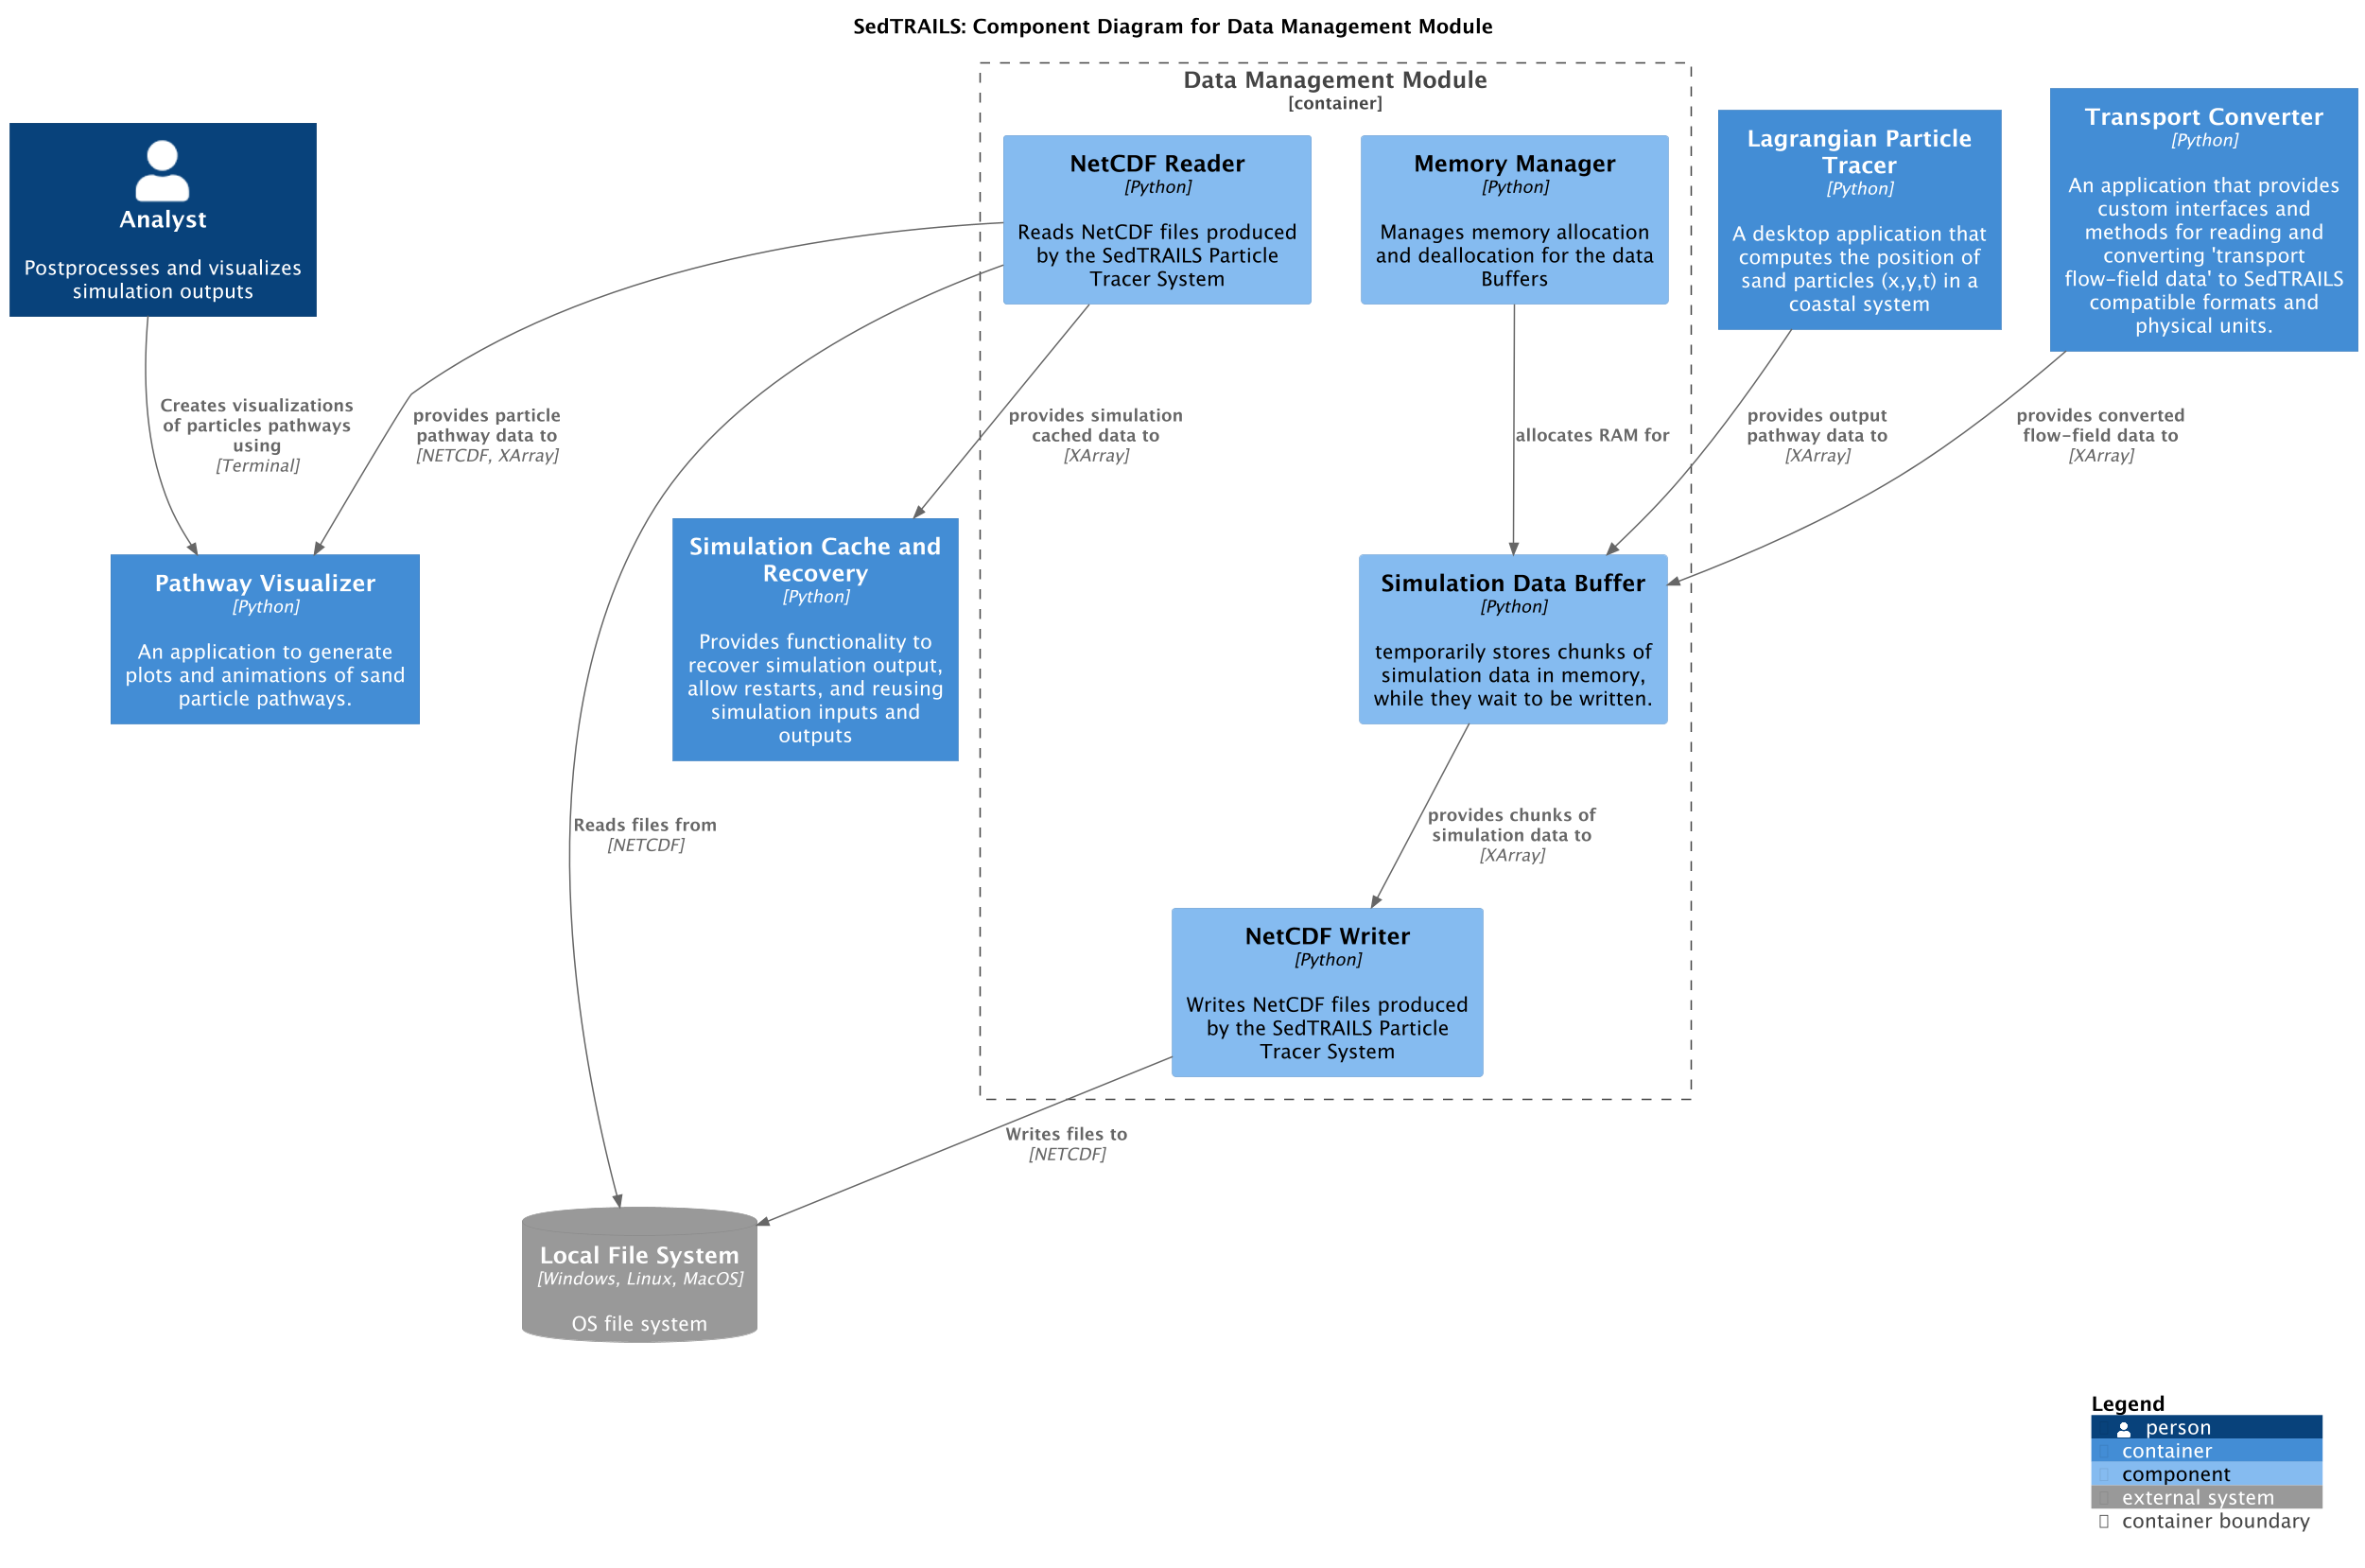
Components:
NetCDF Reader
Reads NetCDF files produced by SedTRAILS
Provides data to visualization and analysis tools
Supports cache data retrieval
NetCDF Writer
Writes simulation results to NetCDF format
Handles standardized output formatting
Simulation Data Buffer
Temporarily stores simulation data chunks in memory
Manages data waiting to be written to disk
Optimizes I/O operations
Memory Manager
Manages memory allocation and deallocation for buffers
Ensures efficient memory usage during simulation
The data manager receives particle pathway data from the tracer and converted flow-field data from the transport converter, buffers it in memory, and writes it to persistent storage. It also provides data access to visualization and analysis tools.
Simulation Analysis Application
The Analysis Application provides post-processing capabilities for simulation outputs.
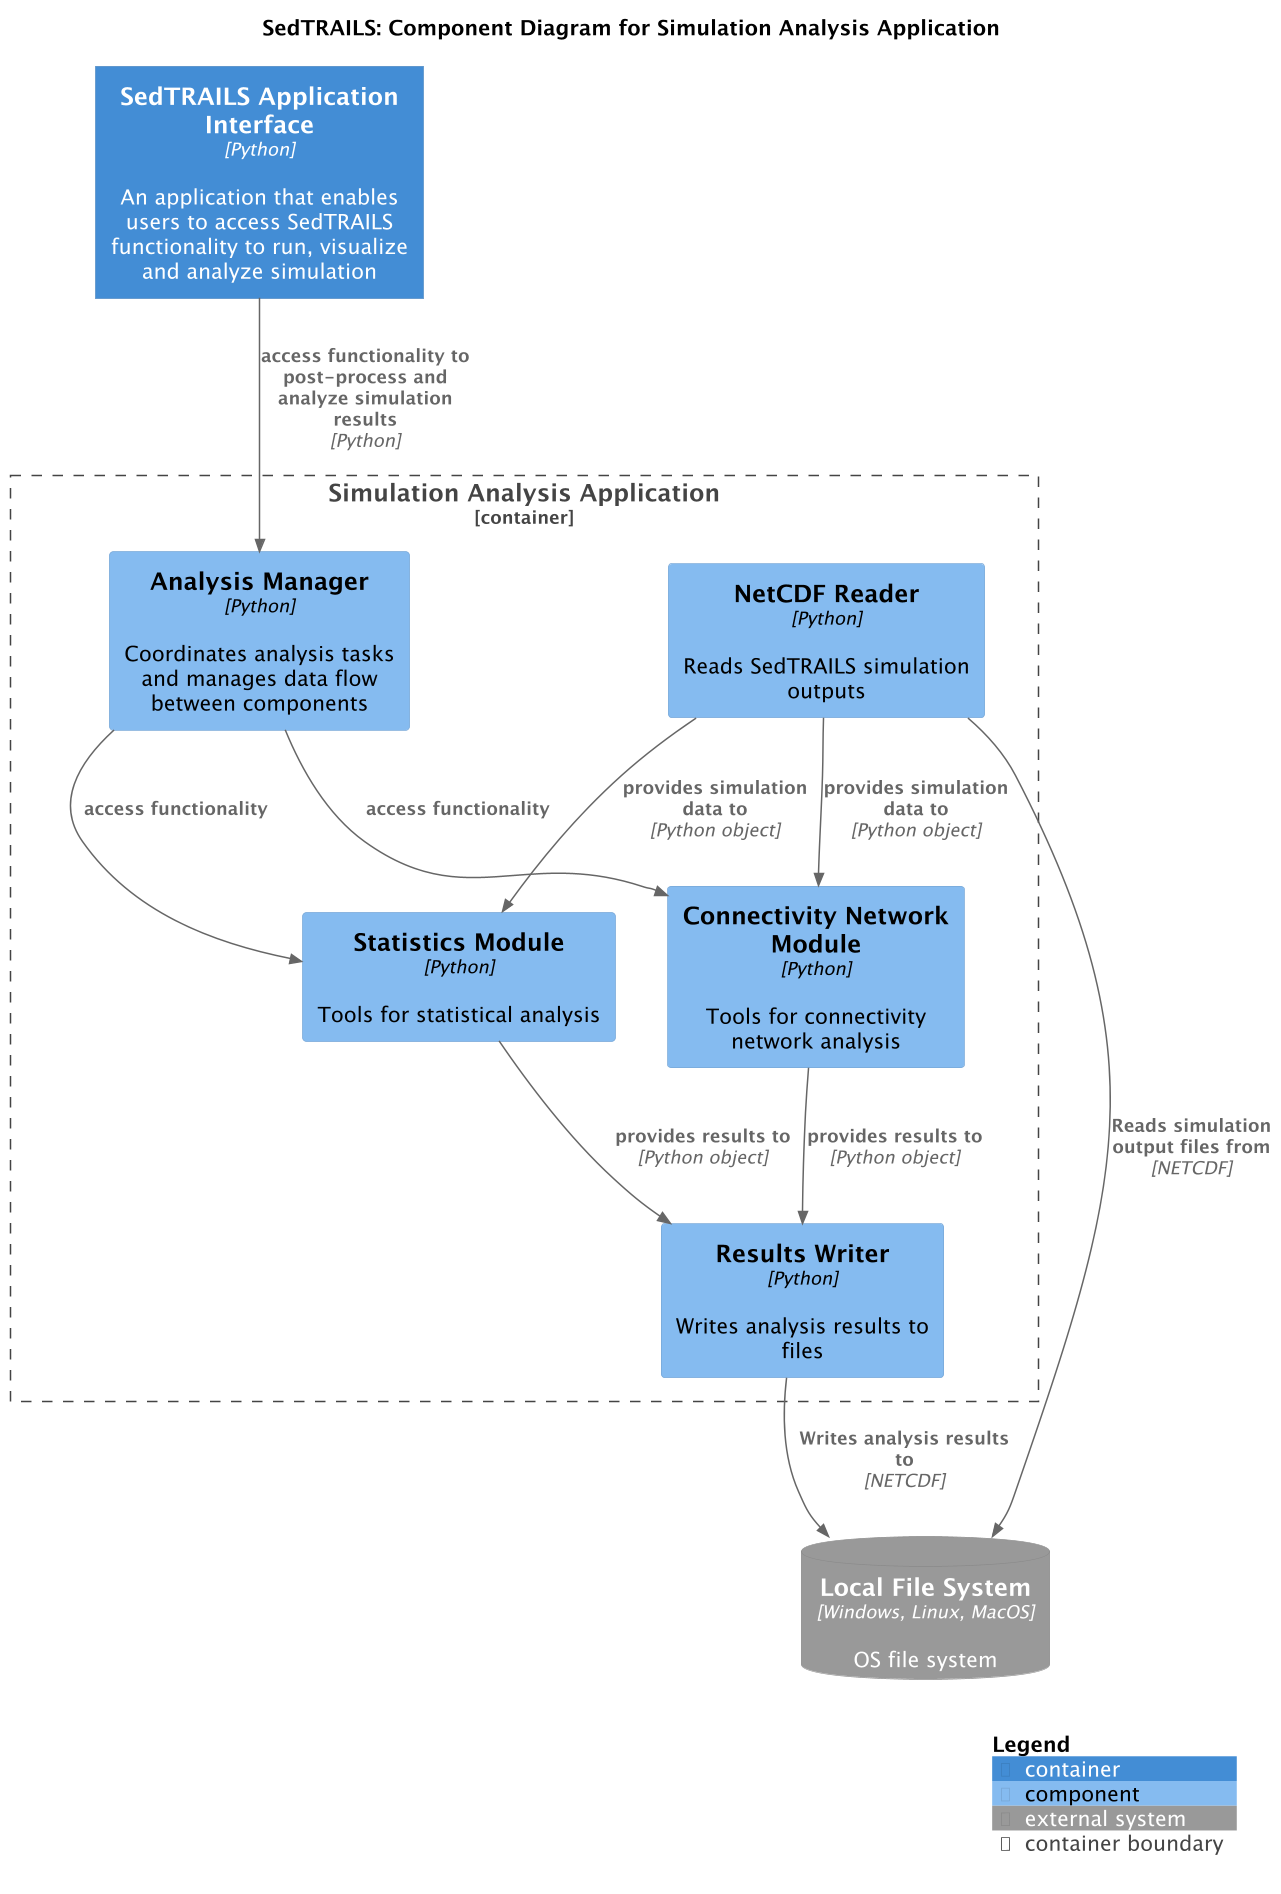
Components:
NetCDF Reader
Reads SedTRAILS simulation output files
Provides data to analysis modules
Results Writer
Writes analysis results to files
Supports various output formats
Statistics Module
Tools for statistical analysis of simulation data
Calculates relevant metrics and distributions
Connectivity Network Module
Tools for connectivity network analysis
Analyzes particle pathway networks
Analysis Manager
Coordinates analysis tasks
Manages data flow between components
Provides unified interface to application API
Users access analysis functionality through the Application Interface, which communicates with the Analysis Manager. The manager coordinates between the reader, analysis modules (statistics and connectivity), and the writer to produce analysis results.
Simulation Cache and Recovery
The Cache and Recovery system ensures resilience and efficient resource utilization.
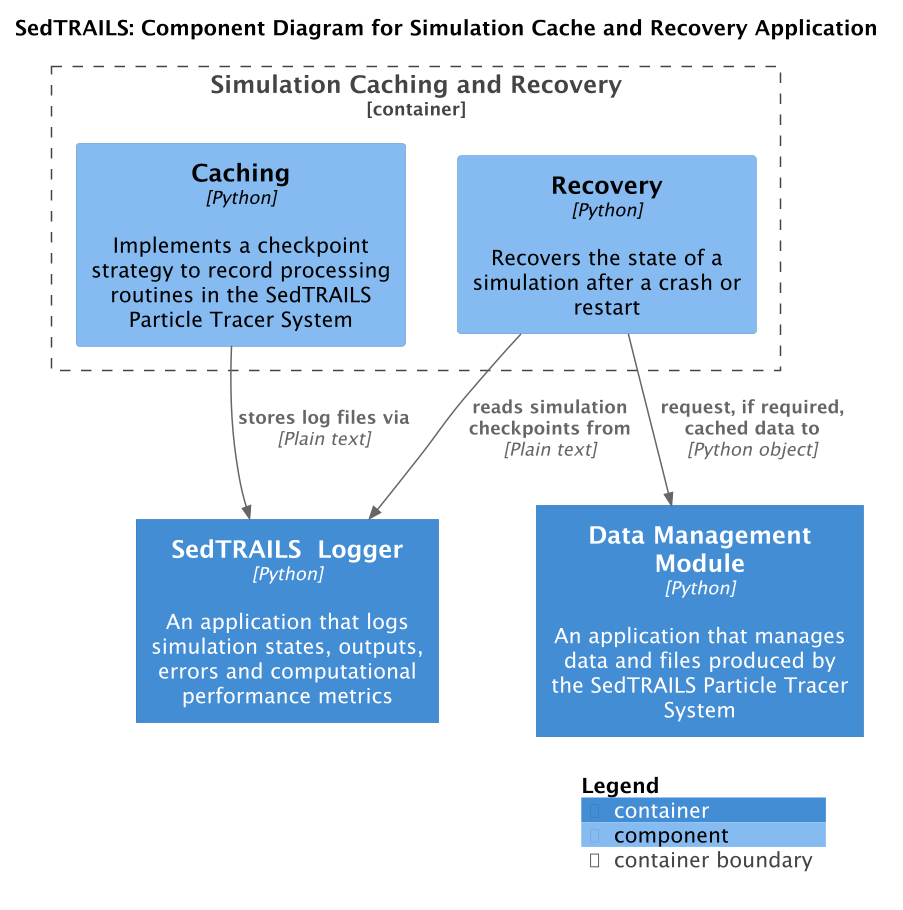
Components:
Caching
Implements checkpoint strategy
Records processing routines for recovery
Stores intermediate simulation states
Recovery
Recovers simulation state after crashes or restarts
Requests cached data from Data Manager when needed
Reads simulation checkpoints from log files
The cache system works closely with the SedTRAILS Logger to store checkpoints and with the Data Manager to cache and retrieve simulation data. This enables interruption recovery and restart capabilities, avoiding redundant computations.
Architecture Principles
1. Modularity
The system is organized into distinct containers and components, each with clear responsibilities. This enables independent development, testing, and maintenance of different parts.
2. Plugin Architecture
The Transport Converter uses a plugin system for format and physics converters, allowing easy extension to support new data formats and transport formulations without modifying core code.
3. Performance Optimization
Critical computational components (Position Calculator) use Fortran for performance, while Python provides flexibility for orchestration and I/O operations. Parallel processing is employed for particle tracking.
4. Configuration-Driven
All simulation parameters are defined in YAML configuration files with schema validation, enabling reproducible simulations and easy parameter management.
5. Data Flow Optimization
Buffering strategies in both the Transport Converter and Data Manager optimize I/O operations and memory usage during large-scale simulations.
6. Resilience
The Cache and Recovery system provides checkpoint/restart capabilities, making the system resilient to interruptions and enabling efficient reruns.
Technology Stack
Primary Language: Python 3.10-3.13
GUI Framework: Qt (Simulation Dashboard)
Data Formats: NetCDF (primary), CSV, TXT
Configuration: YAML with JSON schema validation
CLI Framework: Typer
Parallel Processing: Python multiprocessing
Scientific Computing: NumPy, with Numba acceleration
Deployment and Usage
SedTRAILS can be used in multiple ways:
Command Line: Using the CLI for batch simulations and analysis
Python API: Primary interface for Python users who want to use SedTRAILS programmatically.
The system integrates with various Eulerian flow modeling systems (Delft3D, FM NetCDF, etc.) and provides standardized outputs for analysis and visualization.